Profile Processor Performance
What's a CPU profile?
A CPU profile is a report that shows how the CPU was used over a period of time. It can show which programs were using the most CPU time, which processes were running, and how much time was spent in each state. With CPU profiles, you can identify performance bottlenecks and optimize CPU resource utilization.
Precondition
-
Processor SDK version should be 2.38.0 or later.
SDK version can be viewed under "Project -> Datasource -> Version Details" page:

View SDK version
-
Project's processor should be Sentio Processor. Currently, the Subgraph processor does not support profiling.
Start profiling via Processor page
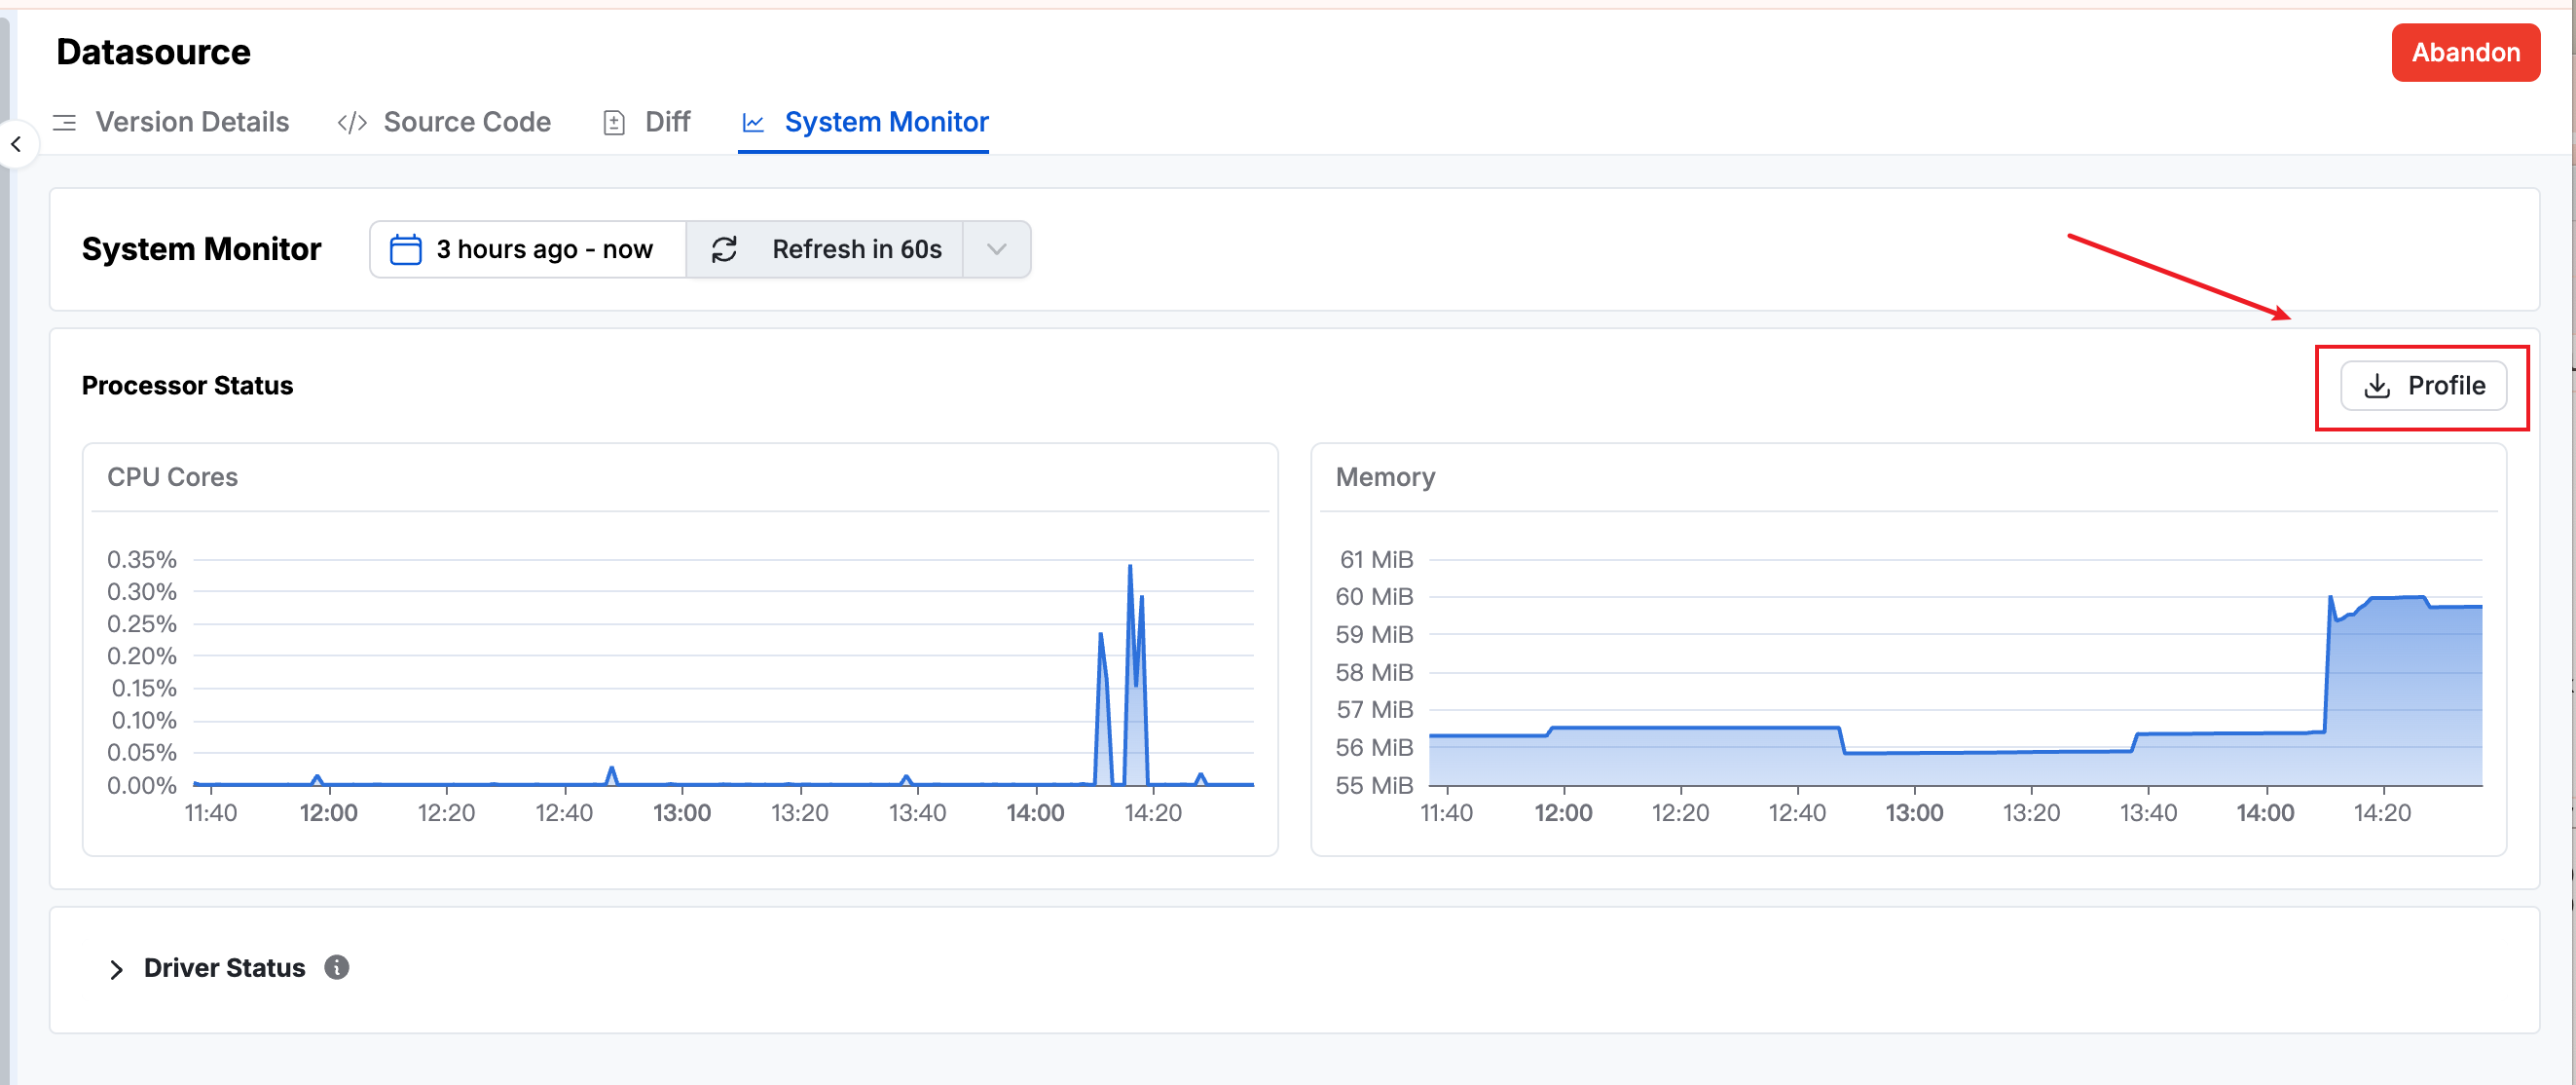
- Open "Datasource -> System Monitor", then click the "Profile" button to open the profile dialog.

Open profiling dialog
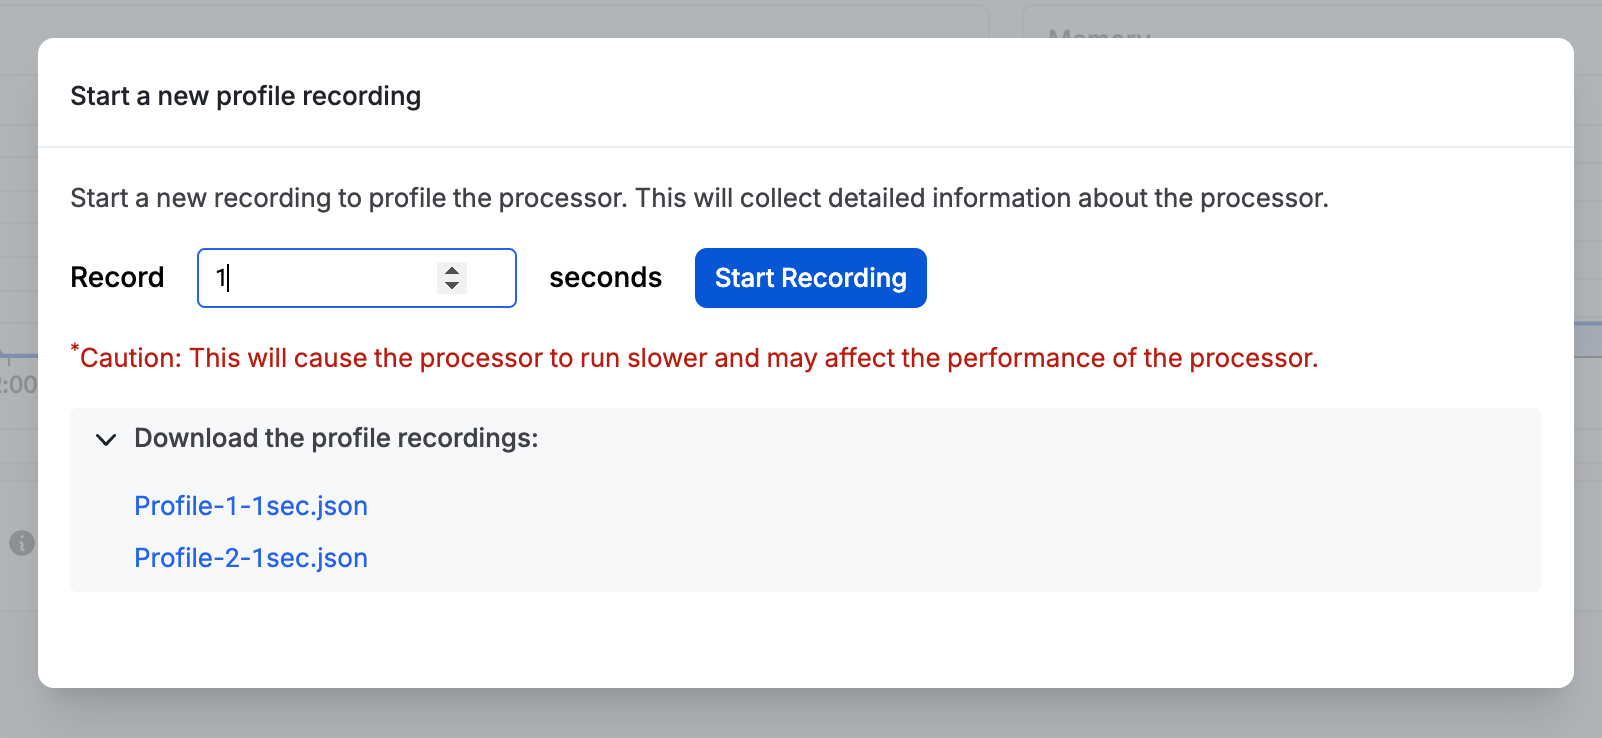
- Select the profile recording duration and click "Start Recording". Wait for the profiling to complete, then you can download the profile output files.

Start Recording
Analyze profiling results
To analyze the profiling results, use any flame graph tool. A convenient option is Chrome DevTools.
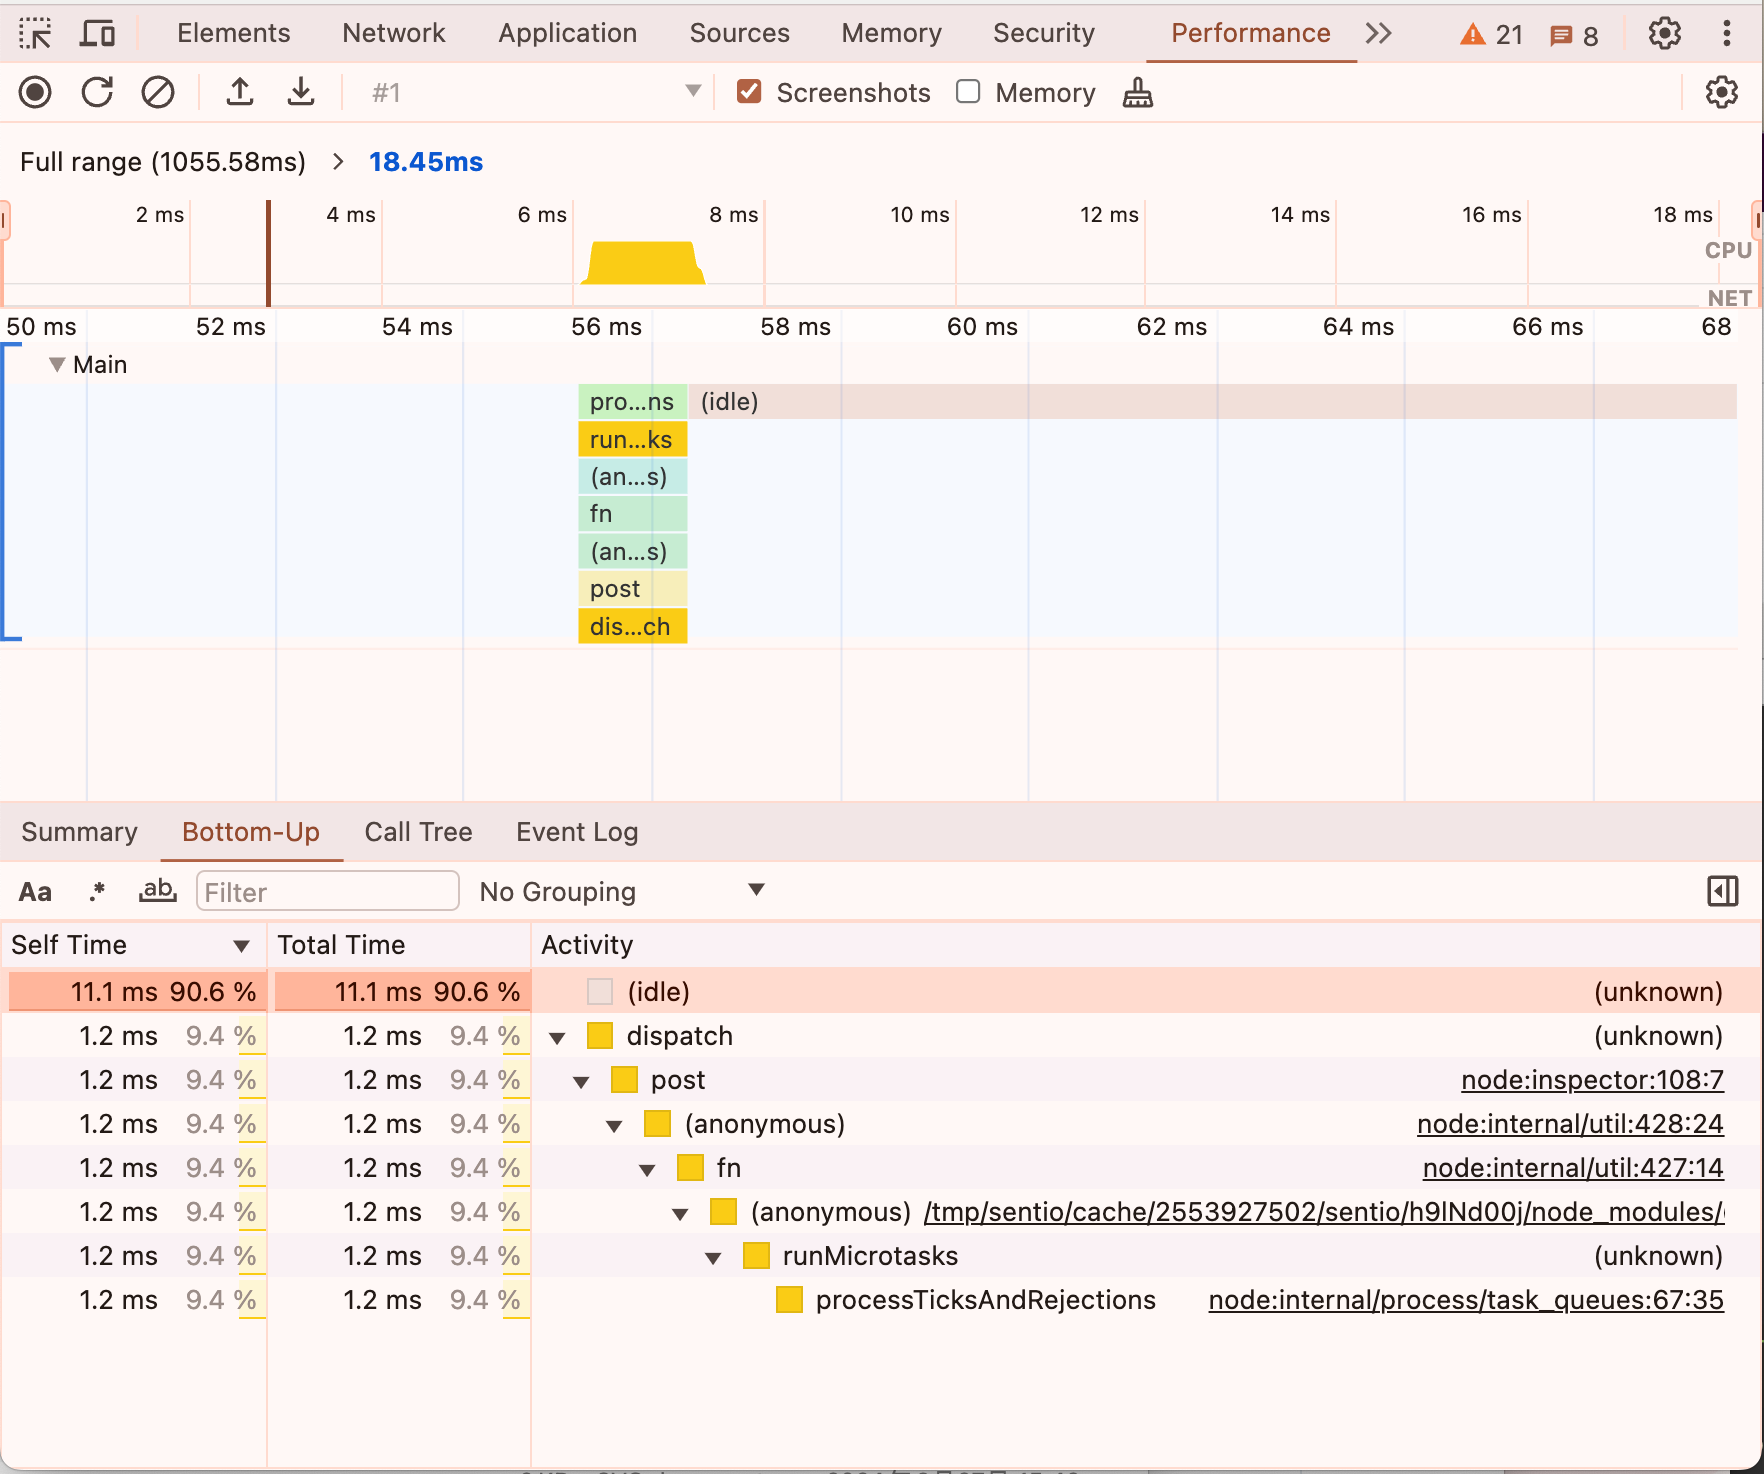
Open Chrome DevTools, go to the Performance panel, and import the profile files.

Chrome DevTool Guide
Once the profile is loaded, you can use the "Bottom-Up" view to analyze performance:
- Select "Bottom-Up" View: In the bottom panel, click on the "Bottom-Up" panel.
- Examine Function Times: This view lists functions sorted by their total time. The total time is the sum of all time spent in the function itself and in all its child functions.
- Identify Hotspots: Look for functions with high total times, which indicate they are significant performance bottlenecks. These functions might not appear at the top of the call stack but still consume a lot of resources.
- Focus on Critical Functions: Click on a function to see a breakdown of where and how often it is called. This helps you understand its impact on overall performance.
- Optimize: Based on the insights gained from the "Bottom-Up" view, identify functions that take the most time and focus on optimizing them to improve overall performance.
For a tutorial on Chrome DevTools, refer to this post to learn more.
Updated 7 days ago
