➡ View Metrics
Metadata
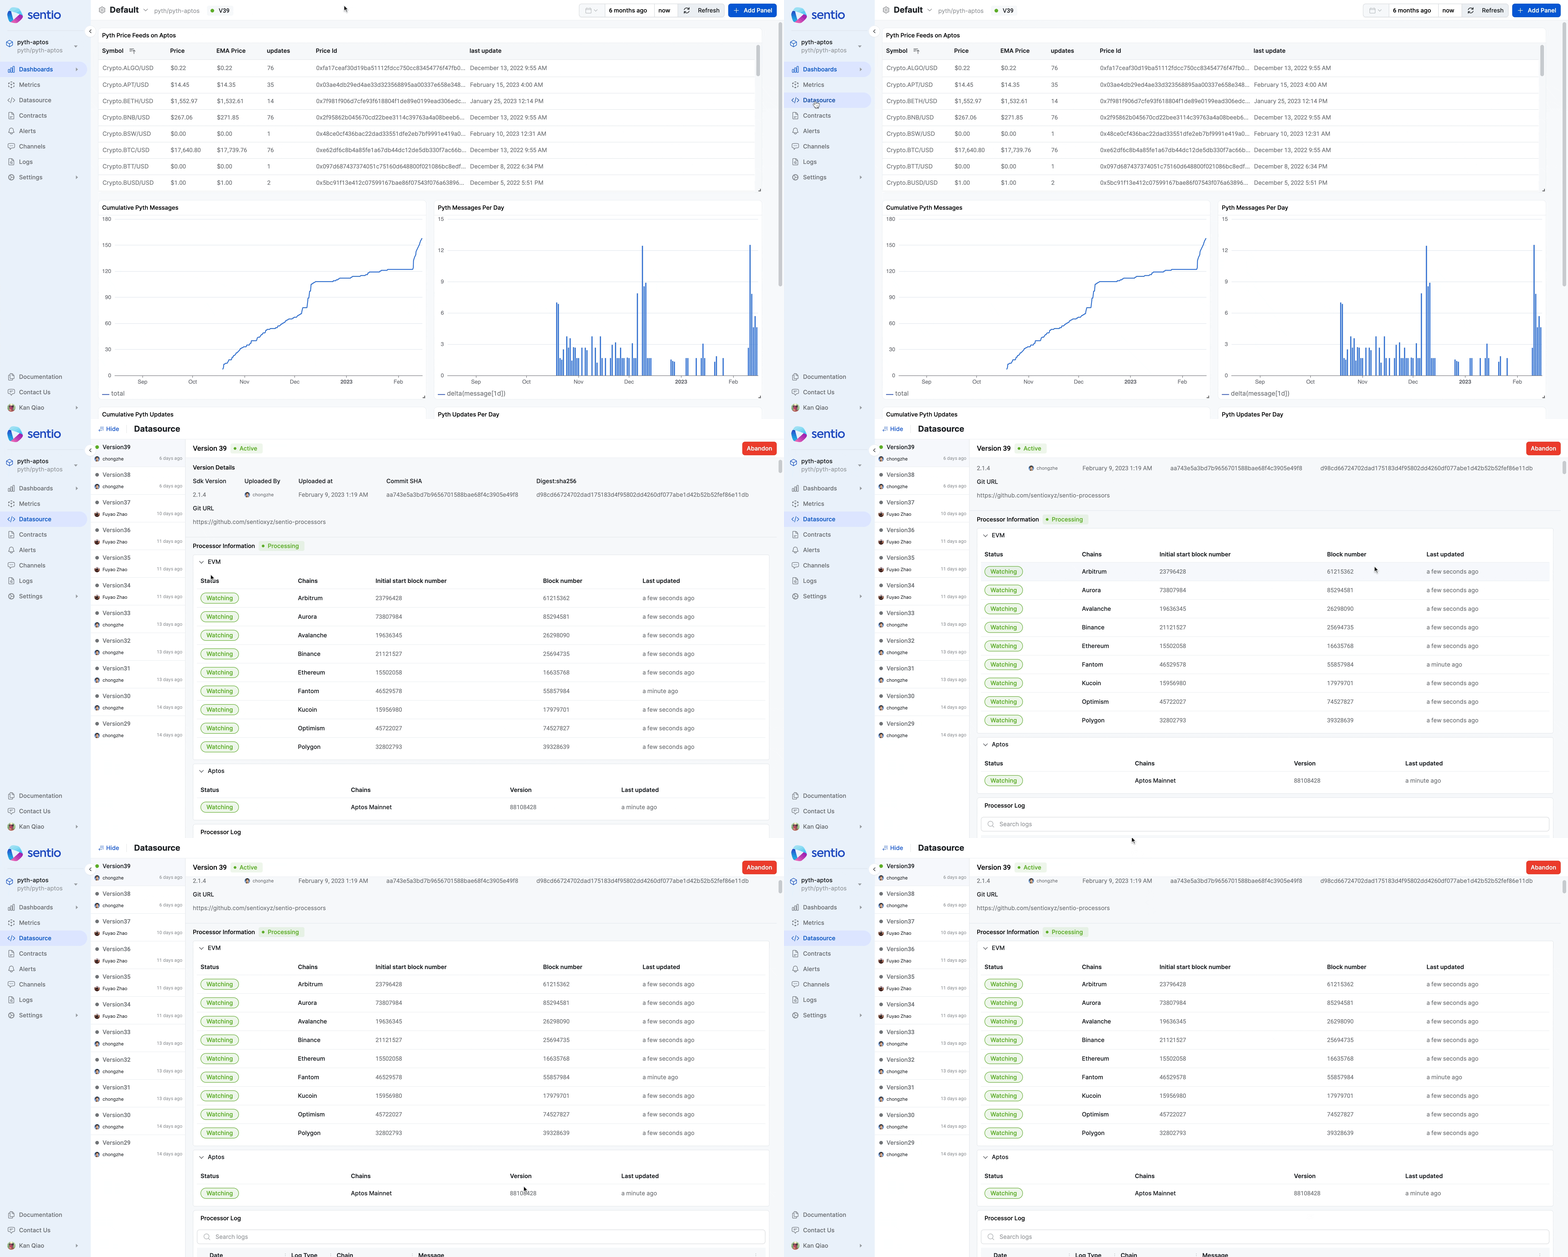
After the processor is successfully uploaded, you can first check the status of the processor on Datasource tab. Make sure the status is shown as PROCESSING. Also, take notice of the block number or Version on each chain (Yes, we support multi-chain: multi-chain-support) is processed at.

Viewing Data Source
You can also examine the status of the collected metrics on the Metrics tab.
%20(4)%20(1).png)
Viewing Metrics
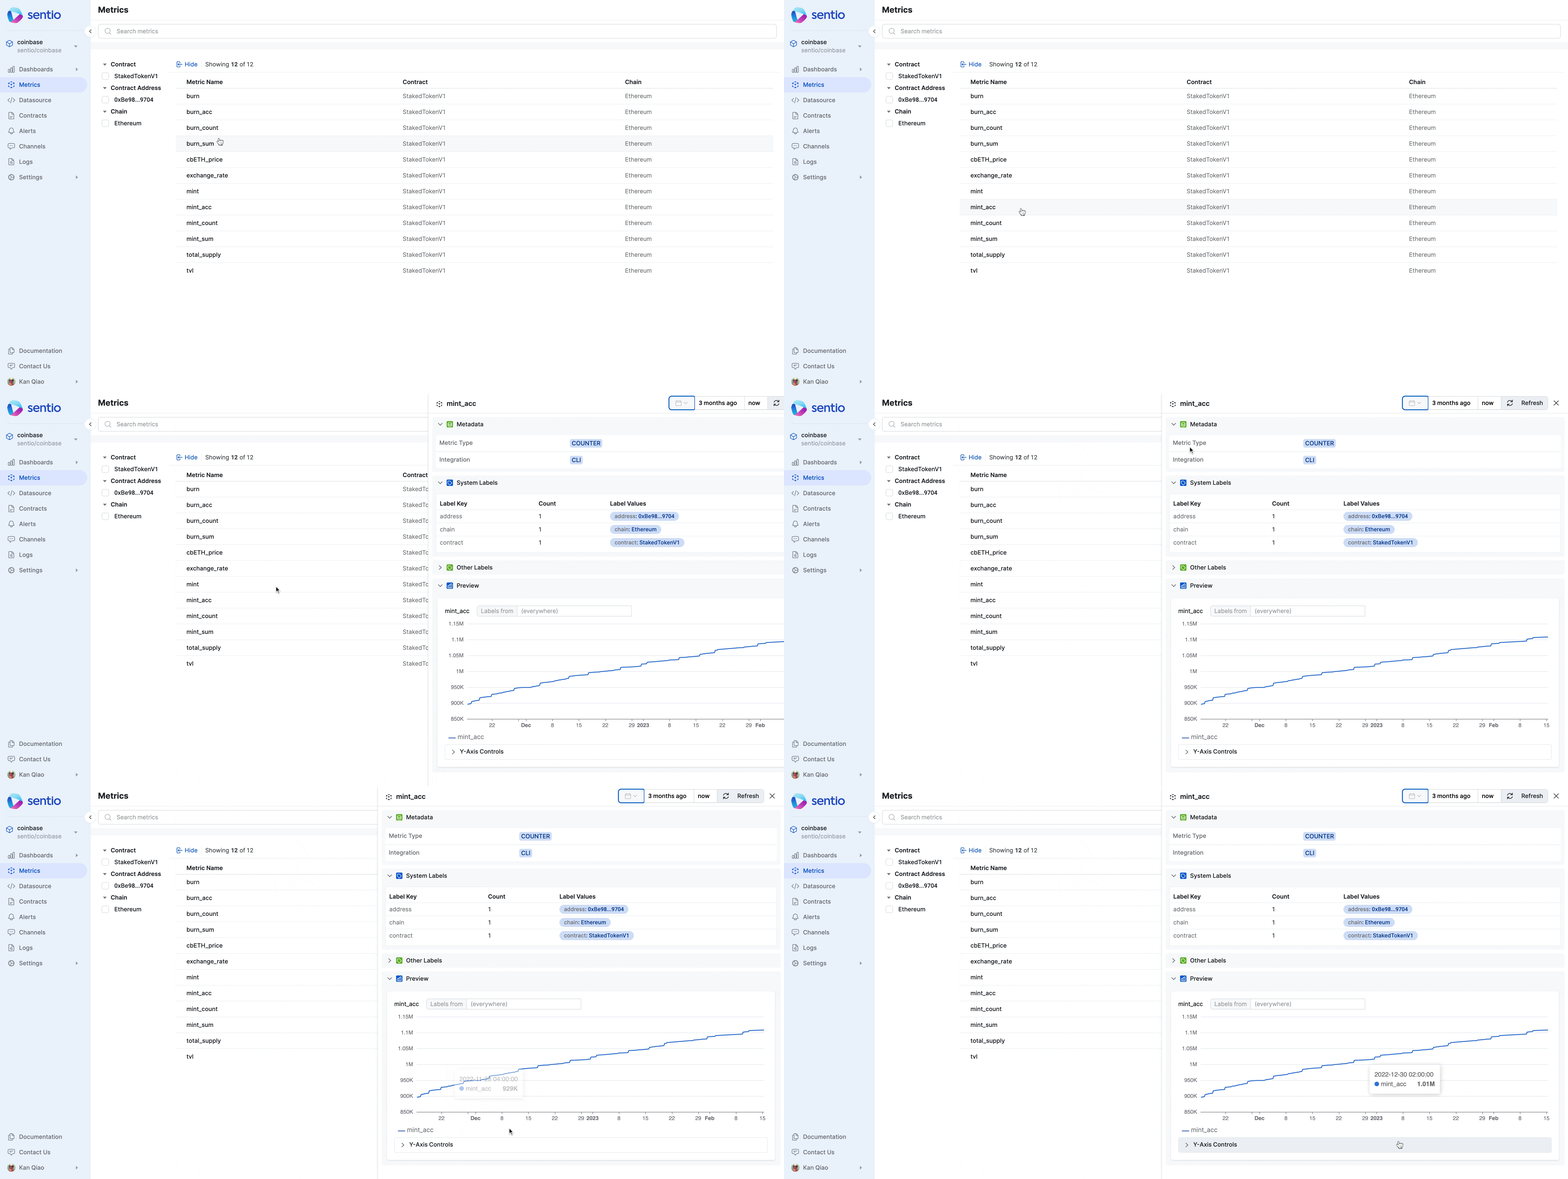
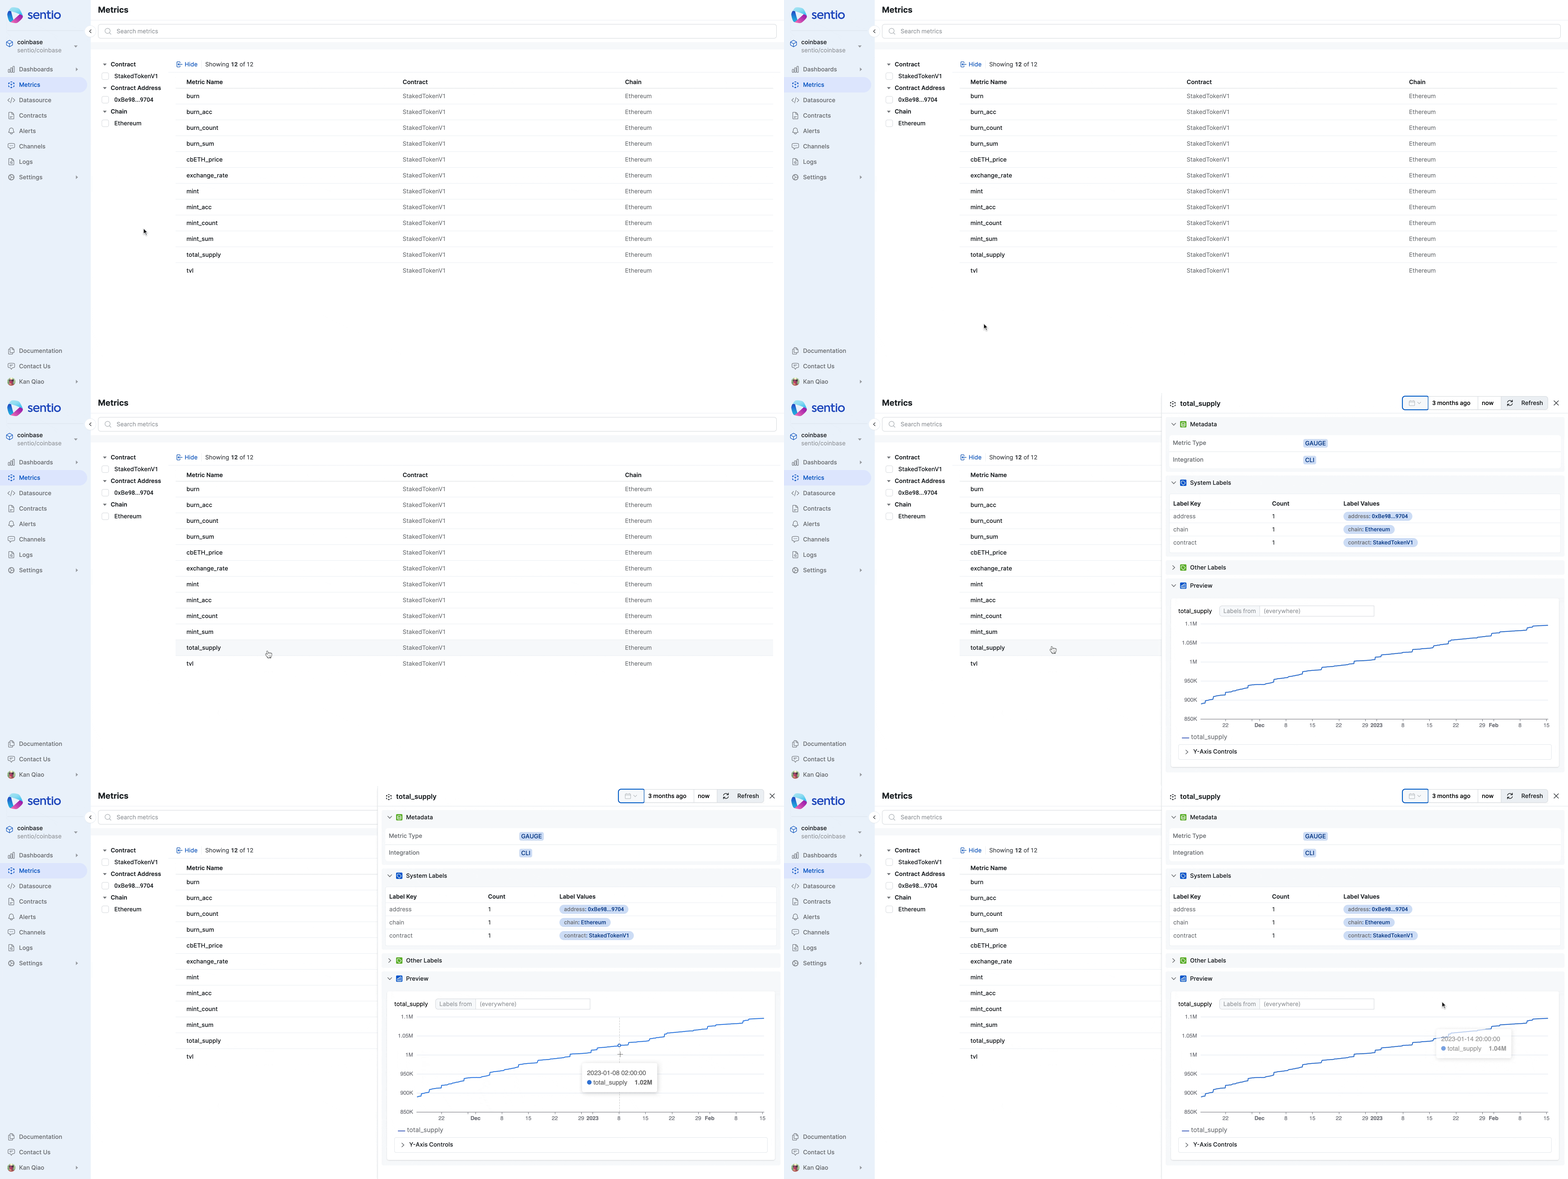
Clicking on each metric gives you a more detailed view of the metric, including tags and visualization of the metrics.
Single metric on UI
For the metric generated by monitor coinbase cbeth mint burn via events, the corresponding metric mint_acc is:

Viewing a single metric mint_acc
For the metric generated by monitor-totalsupply-of-cbeth-via-interval, the corresponding metric total_supply is:

Now we have raw metrics. Let's go to build-dashboards
Updated 3 months ago