
📊 Data Studio
Sentio Data Studio is a powerful analytics platform designed for users who need deeper insights and more flexible data analysis capabilities than standard dashboards offer. It provides a comprehensive environment for transforming raw blockchain data into meaningful insights, visualizations, and APIs—all within your browser.
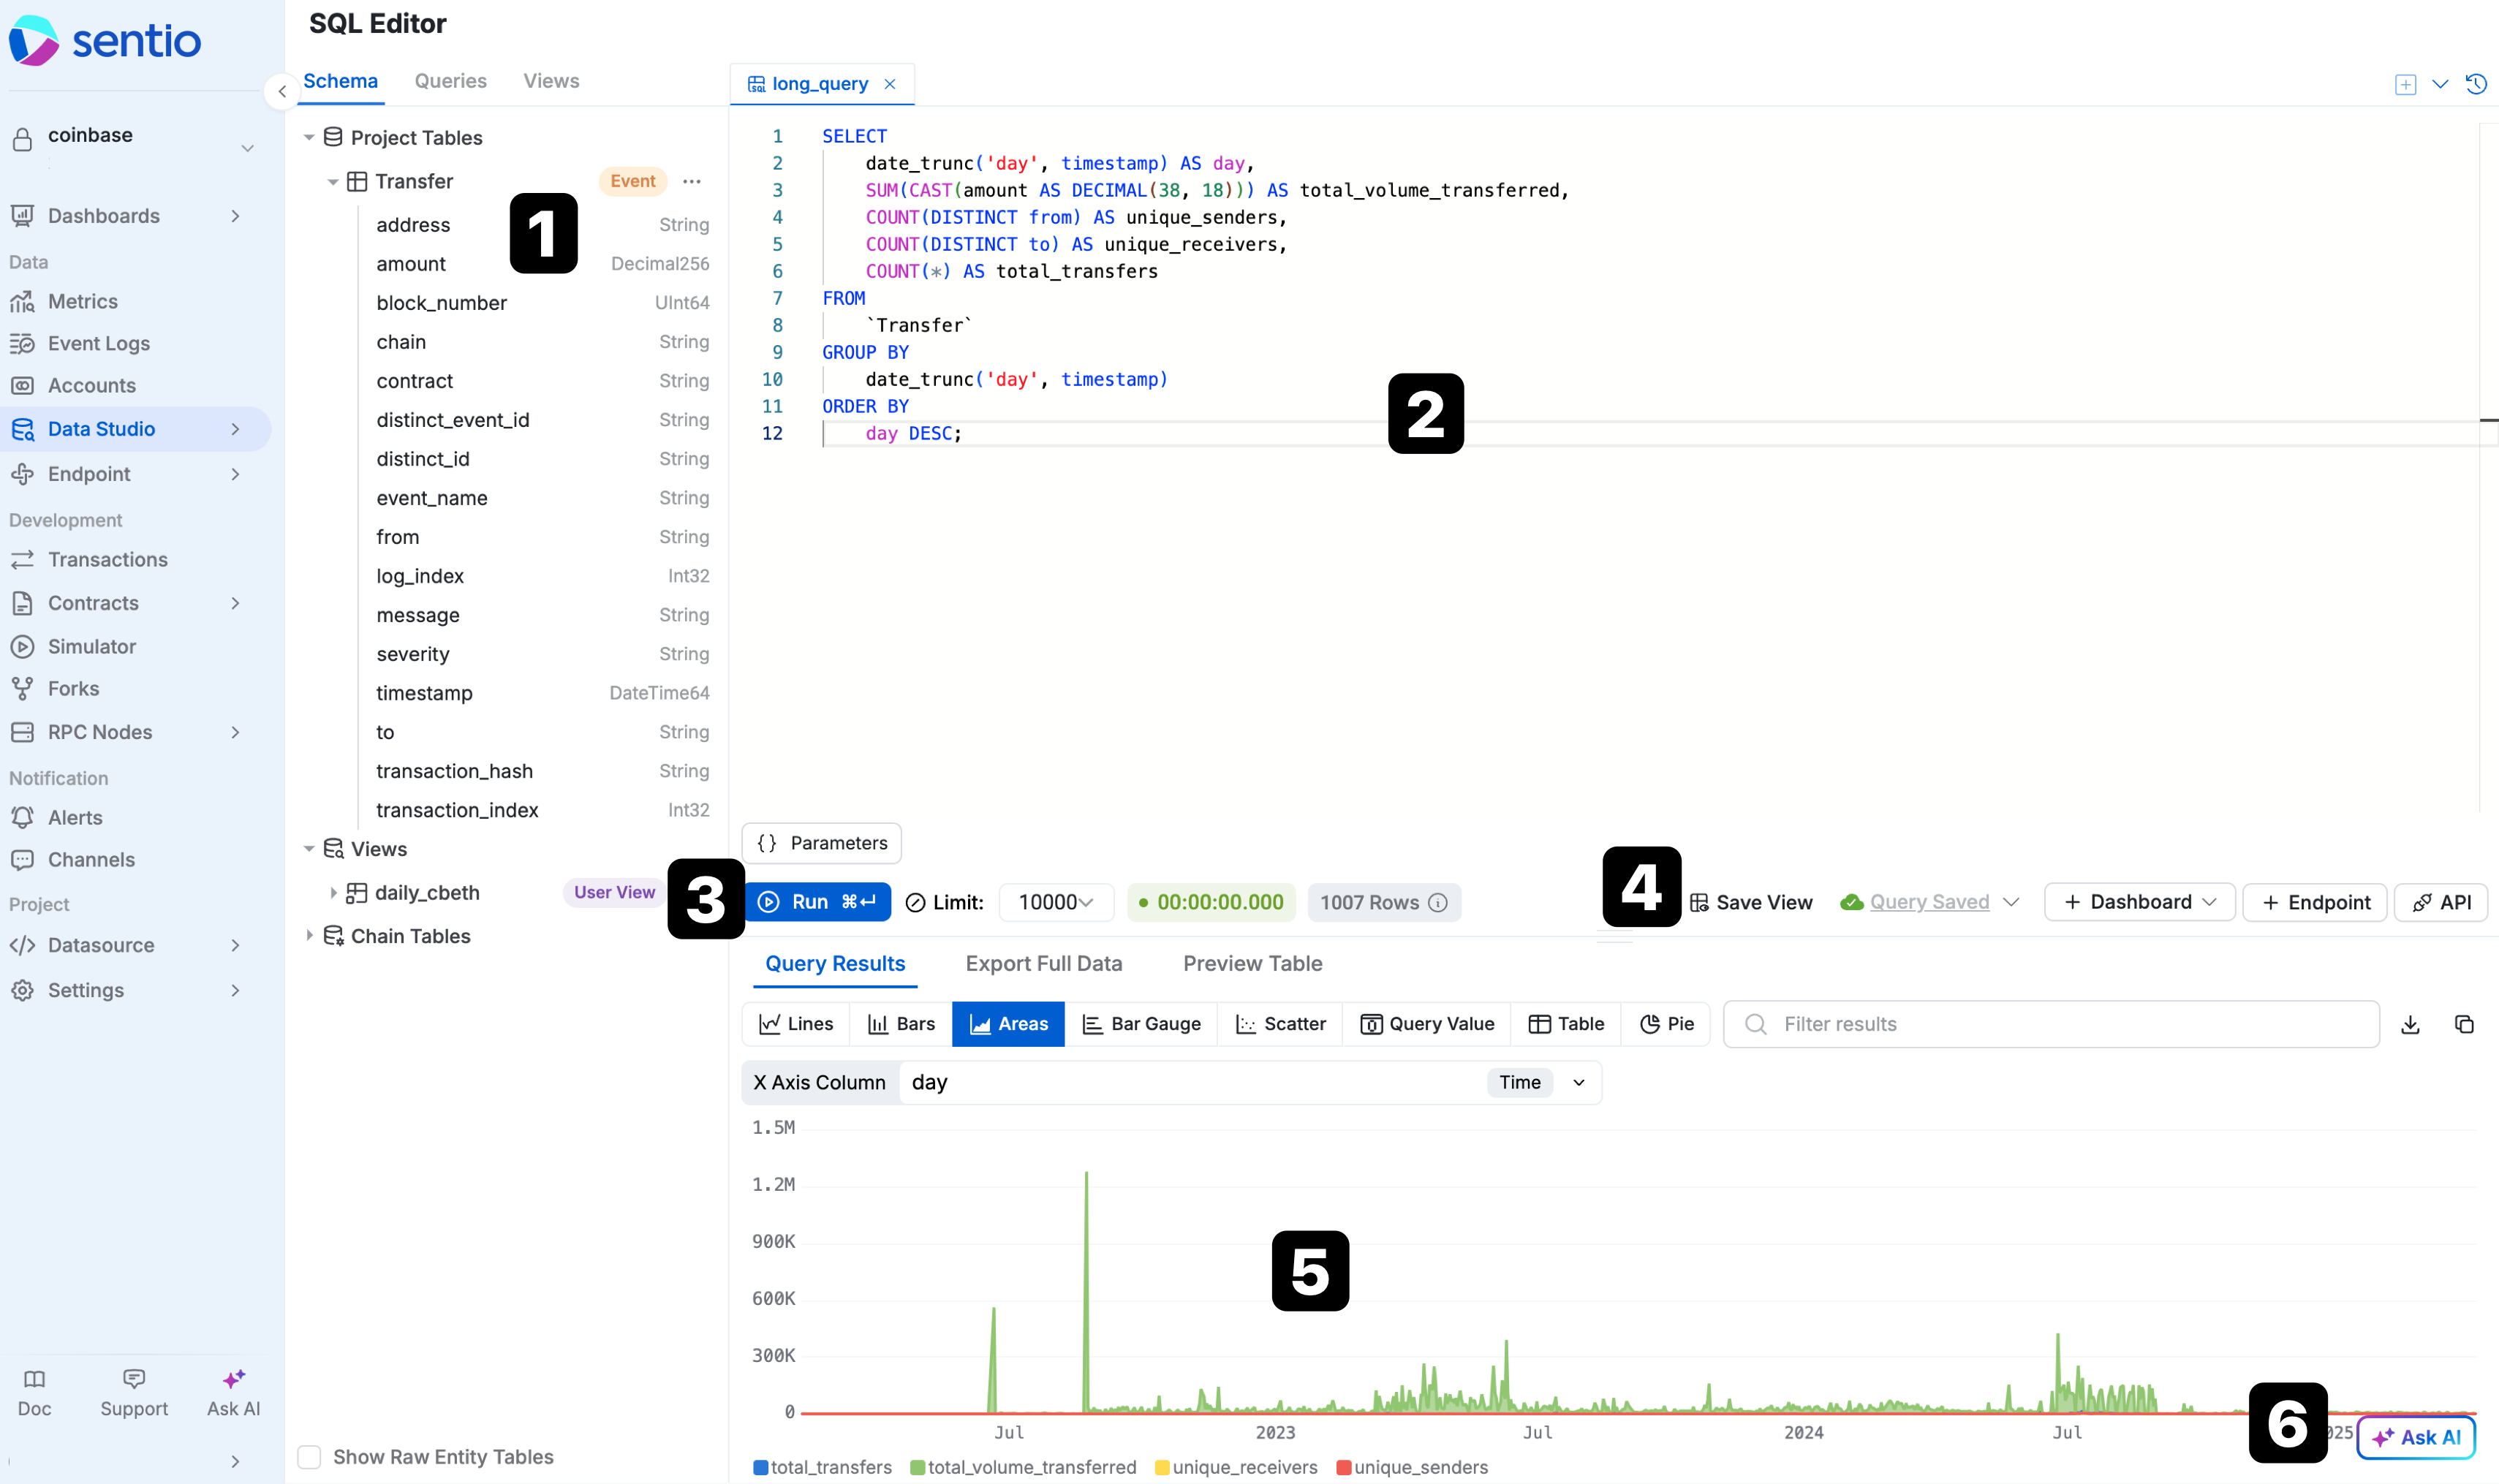
Key components of the Data Studio interface
| Description | Functionality | |
|---|---|---|
| ① | Schema Panel | Browse available tables, saved queries, and views. |
| ② | SQL Editor | Supports autocomplete, multiple tabs, and keyboard shortcuts (⌘/Ctrl + Enter to run). |
| ③ | Run Controls | Configure row limits and view execution time metrics. |
| ④ | Results Pane | Toggle between Table, Line, Bar, Area, Scatter, or Pie visualizations. |
| ⑤ | Action Buttons | Save Query, Save View (Pro), Add to Dashboard, Create Endpoint. |
| ⑥ | AI Assistant | Seamlessly integrated, AI assistance extends beyond the dedicated 'Ask AI' panel, offering contextual suggestions and actions directly inline when you select text within the SQL editor. |
1. Writing and Executing Your First Query
The core of Data Studio is its powerful SQL editor.
-
Explore Data: Before writing your query, you can preview table schemas and sample data directly in the Schema Panel (① in the image below) on the left. This helps you understand the available fields and their content. Click on table or column names to auto-insert them into your query.
-
Write Your SQL: Use the SQL Editor (②) to compose your queries. It features syntax highlighting and autocomplete to streamline the process.
-
AI Assistance: Leverage the built-in AI Assistant (⑥) to:
- Generate SQL queries from natural language descriptions.
- Explain complex SQL logic.
- Optimize query performance by identifying bottlenecks or suggesting improvements.
Daily number of transfers over the last 30 days

Recent transfers for a specific ERC20 token
2. Running Queries and Visualizing Results
As you refine your SQL, you can instantly see the impact.
SELECT
    date_trunc('day', timestamp)                 AS day,
    SUM(CAST(amount AS DECIMAL(38,18)))          AS total_volume,
    COUNT(DISTINCT from)                         AS unique_senders,
    COUNT(DISTINCT to)                           AS unique_receivers,
    COUNT(*)                                     AS transfers
FROM "Transfer"
GROUP BY
    date_trunc('day', timestamp)
ORDER BY
    day DESC;
Tip: Click on column names liketimestamp,amount,from, andtoin the Schema panel to auto-insert them into your query.
- Execute your query by clicking the Run button or pressing ⌘/Ctrl + Enter
- Review the tabular results to verify data accuracy
- If the results aren't quite right, simply go back to the SQL editor pane above, modify your query, and click Run again. Repeat this cycle until the preview shows the exact data you need for your analysis.
3. Visualizing Query Results
-
Switch to your preferred visualization type (Line, Bar, etc.) to create charts.
-
Hover over data points to see detailed values without additional coding.
-
Directly integrate your query's visualization into a Sentio Dashboard for ongoing monitoring and analysis alongside other metrics.
4. Using Queries as Endpoints/APIs
Once your SQL query is finalized, Data Studio offers several ways to share or reuse your analysis (using the Action Buttons ⑤):
- Create Endpoint: Transform your query into a live API endpoint. This generates a REST API URL that returns paginated JSON results, perfect for powering external applications, bots, or custom frontends. You can configure endpoint slugs, permissions (Public/Private), and default parameter values if your query uses variables (e.g.,
{{address}}).
- Use SQL API: Unlike endpoints, using the SQL API requires passing SQL parameters with each request. Based on the parameters provided, you can dynamically query and retrieve the data you need in real-time.
5. Leveraging Advanced Features
- Save Query (Free & Pro): Stores the SQL definition for personal use or work-in-progress.
- Save View (Pro): Creates a materialized view from your SQL, storing pre-calculated results for faster future access. For a more detailed guide, please refer to ⚡ Materialized Views.
- Export Results: Download the raw data from your query results table in formats like CSV for use in other tools or further offline analysis. (Note: Look for an "Export" button in the Results Pane).
-
Types of datasets: Beyond analyzing data from your own processed events and states, Sentio curates a series of datasets within the Schema Panel (①).
- Curated Data: Access a growing library of valuable, pre-processed datasets covering various blockchain activities and protocols (e.g., decoded DEX trades, NFT metadata). These datasets, cleaned and maintained by the Sentio team, are listed under their respective chain tables in the Schema Panel.
- Chain Data: Access fundamental blockchain data like transactions and blocks. This raw data is also listed under the respective chain tables in the Schema Panel.
These official and shared data sources are continuously updated and expanded. Keep an eye on the Schema Panel for new datasets to enrich your analysis! We also welcome you to share your valuable data.
6. Optimizing Performance with Execute Engine Size
Sentio's Data Studio gives you direct control over the computational resources allocated to your queries by allowing you to select an Execute Engine Size. This is especially useful for complex or long-running analyses where higher performance can significantly reduce execution time.
To select an engine size, simply click the dropdown arrow next to the Run button before executing your query. The currently selected tier is displayed on the button itself.
You can choose from the following performance tiers:
- Small: Basic performance and minimal resources. This is the default setting and is ideal for simple, exploratory queries.
- Medium: Balanced performance and resource limits. A good choice for moderately complex queries that require a boost in speed.
- Large: High performance with increased speed and resources. Recommended for demanding analytical queries on large datasets.
- Ultra: Top-tier performance with maximum speed and resource allocation. Designed for the most computationally intensive queries.
💰 Pricing and Consumption
| Engine Size | Description | Cost per Query (Sentio Units) |
|---|---|---|
| Small | Basic performance and minimal resources. | 1,000 |
| Medium | Balanced performance and resource limits. | 1,250 |
| Large | High performance with increased speed and resources. | 1,500 |
| Ultra | Top-tier performance with maximum resource allocation. | 2,000 |
Important Notes on Billing and Free Tier UsageFree Tier Allowance: Our Free Tier includes a monthly allowance of 200,000,000 Sentio Units. This allowance can be used to run queries on the Small engine size.
Upgrading Engine Size: To use the Medium, Large, or Ultra engines, you will need to be on a paid plan.
UI-Initiated Queries: It's important to note that queries automatically initiated by the Sentio UI (such as dashboard panel refreshes) do not currently consume any Sentio Units. This policy is subject to change.
Updated 5 months ago