🖥️ RPC Nodes
RPC Archive Nodes
Access reliable, high-performance blockchain data with Sentio's integrated RPC Archive Nodes. Query complete historical blockchain data, monitor usage in real-time, and streamline your dApp development workflow—all within the Sentio platform.
Overview
Sentio RPC Archive Nodes provide direct access to full historical blockchain data across multiple networks. With transparent pay-per-request billing and comprehensive monitoring, you can optimize your blockchain interactions while maintaining complete visibility into costs and performance.
Supported Networks
- Ethereum Mainnet
- Movement Testnet & Mainnet
- Aptos Testnet & Mainnet
Getting Started
Creating Your First RPC Node
-
Access RPC Nodes
Navigate to "RPC Nodes" in the left sidebar of the Sentio platform. -
Create New Node
Click "+ Create RPC Node" in the top-right corner of the RPC Node List page. -
Configure Network
In the "Create RPC Node" dialog:- Select "Choose Network" dropdown
- Pick your target blockchain network (e.g., Ethereum Mainnet, Aptos Testnet)
-
Deploy Node
Click "Create Node" to provision your RPC Archive Node.
Your new node will appear in the RPC Node List once provisioned.

Managing Your RPC Nodes
Node Overview
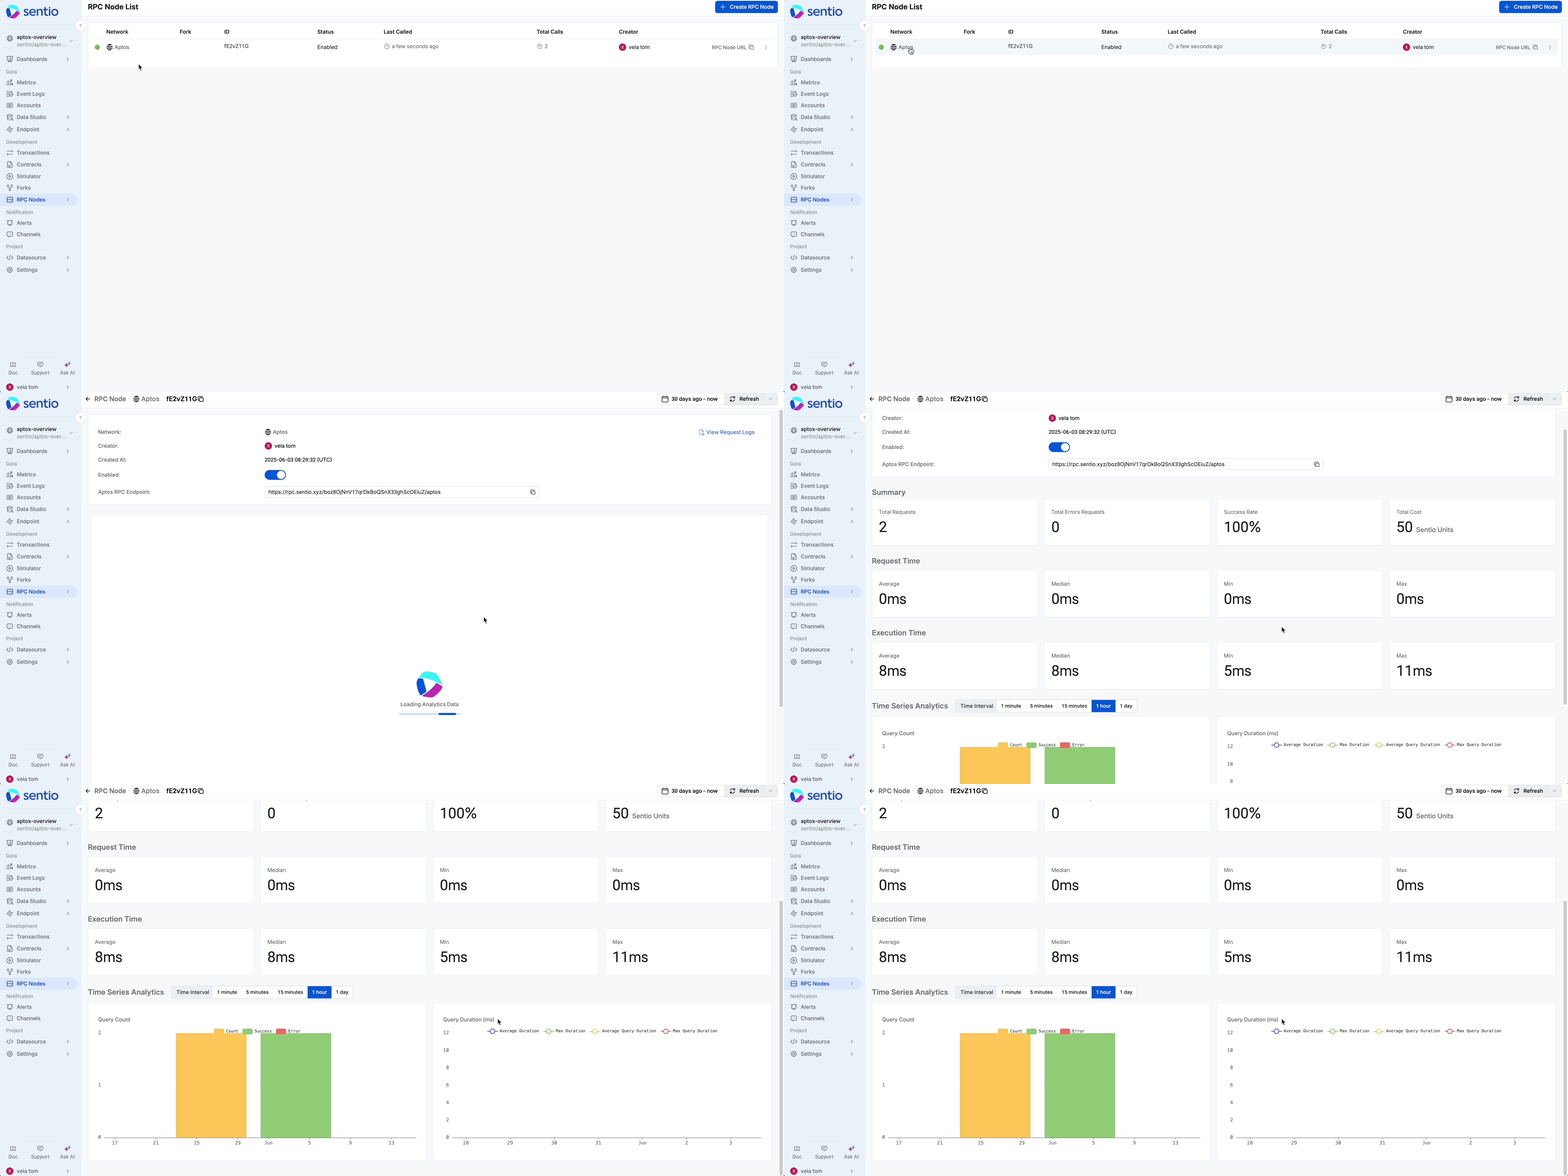
The RPC Node List provides a comprehensive view of all your nodes with key information:
| Column | Description |
|---|---|
| Network | Target blockchain network |
| Fork ID | Forked network identifier (if applicable) - see forks documentation |
| ID | Unique node identifier |
| Status | Current operational status |
| Last Called | Timestamp of most recent API call |
| Total Calls | Cumulative request count |
| Creator | Node creator |
| RPC URL | Endpoint preview |
Node Configuration
Click any node to access its detailed configuration page, where you can:
- Copy Full Endpoint URL: Your unique RPC endpoint for integration with Web3 applications, SDKs (Ethers.js, Aptos SDK), or direct API calls
- Toggle Node Status: Enable or disable your RPC node as needed
Monitoring & Analytics
Performance Dashboard
Each RPC node includes a comprehensive monitoring dashboard with real-time metrics and historical analysis.
Summary Metrics
Monitor your node's key performance indicators:
- Total Requests: Request volume within selected timeframe
- Error Rate: Failed request count and percentage
- Success Rate: Percentage of successful requests
- Total Cost: Accumulated costs in Sentio Units
Performance Analysis
Detailed performance breakdowns including:
- Request Time Statistics: Average, median, minimum, and maximum total response times (including network latency)
- Execution Time Statistics: Processing time metrics for server-side request handling
Time Series Analytics
Visualize usage patterns and performance trends over customizable time intervals:
- 1 minute, 5 minutes, 15 minutes
- 1 hour, 1 day intervals

Request Logs
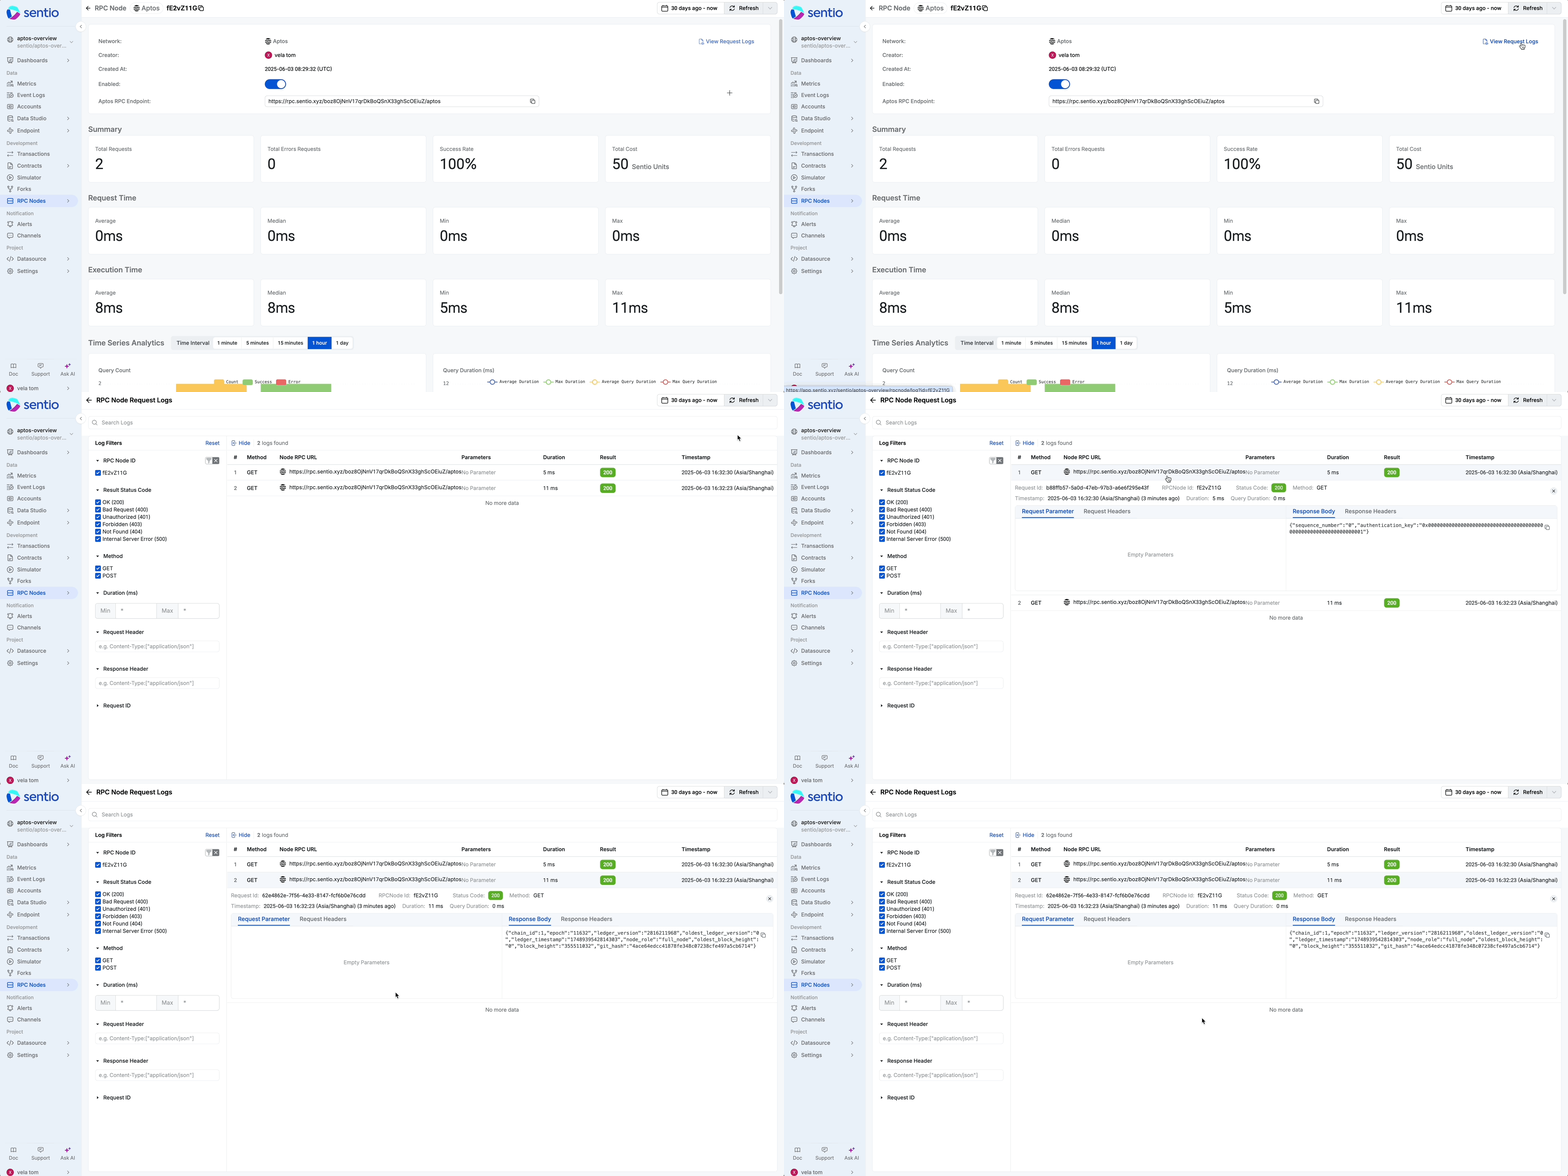
Access detailed request records for debugging and analysis by clicking "View Request Logs".

Billing & Cost Management
Pricing Model
- Pay-Per-Request: Only pay for actual API calls made
- Transparent Costs: Real-time cost tracking in Sentio Units
- No Setup Fees: Start using immediately with no upfront costs
Cost Monitoring
Track expenses through the Summary Metrics dashboard, with detailed breakdowns available for budget planning and optimization.
Next Steps
Ready to get started? Create your first RPC Archive Node and begin leveraging Sentio's robust blockchain infrastructure for your development needs. With full historical data access, transparent monitoring, and flexible billing, you have everything needed for professional blockchain development.
Updated 3 months ago