➡ Build Dashboards
To use the metrics to better do visualization and computation, you could build dashboard using the metrics collected.
This is following the metrics submitted by monitor-coinbase-cbeth-mint-burn-via-events
Here is one example we have a dashboard to show the Mint Activity - 24 Hours Aggregation.
.gif)
Here we take a metric and apply a rollup function to perform 24 hours sum aggregation. For more about the formula and functions, refer to aggregation-functions-and-formulas
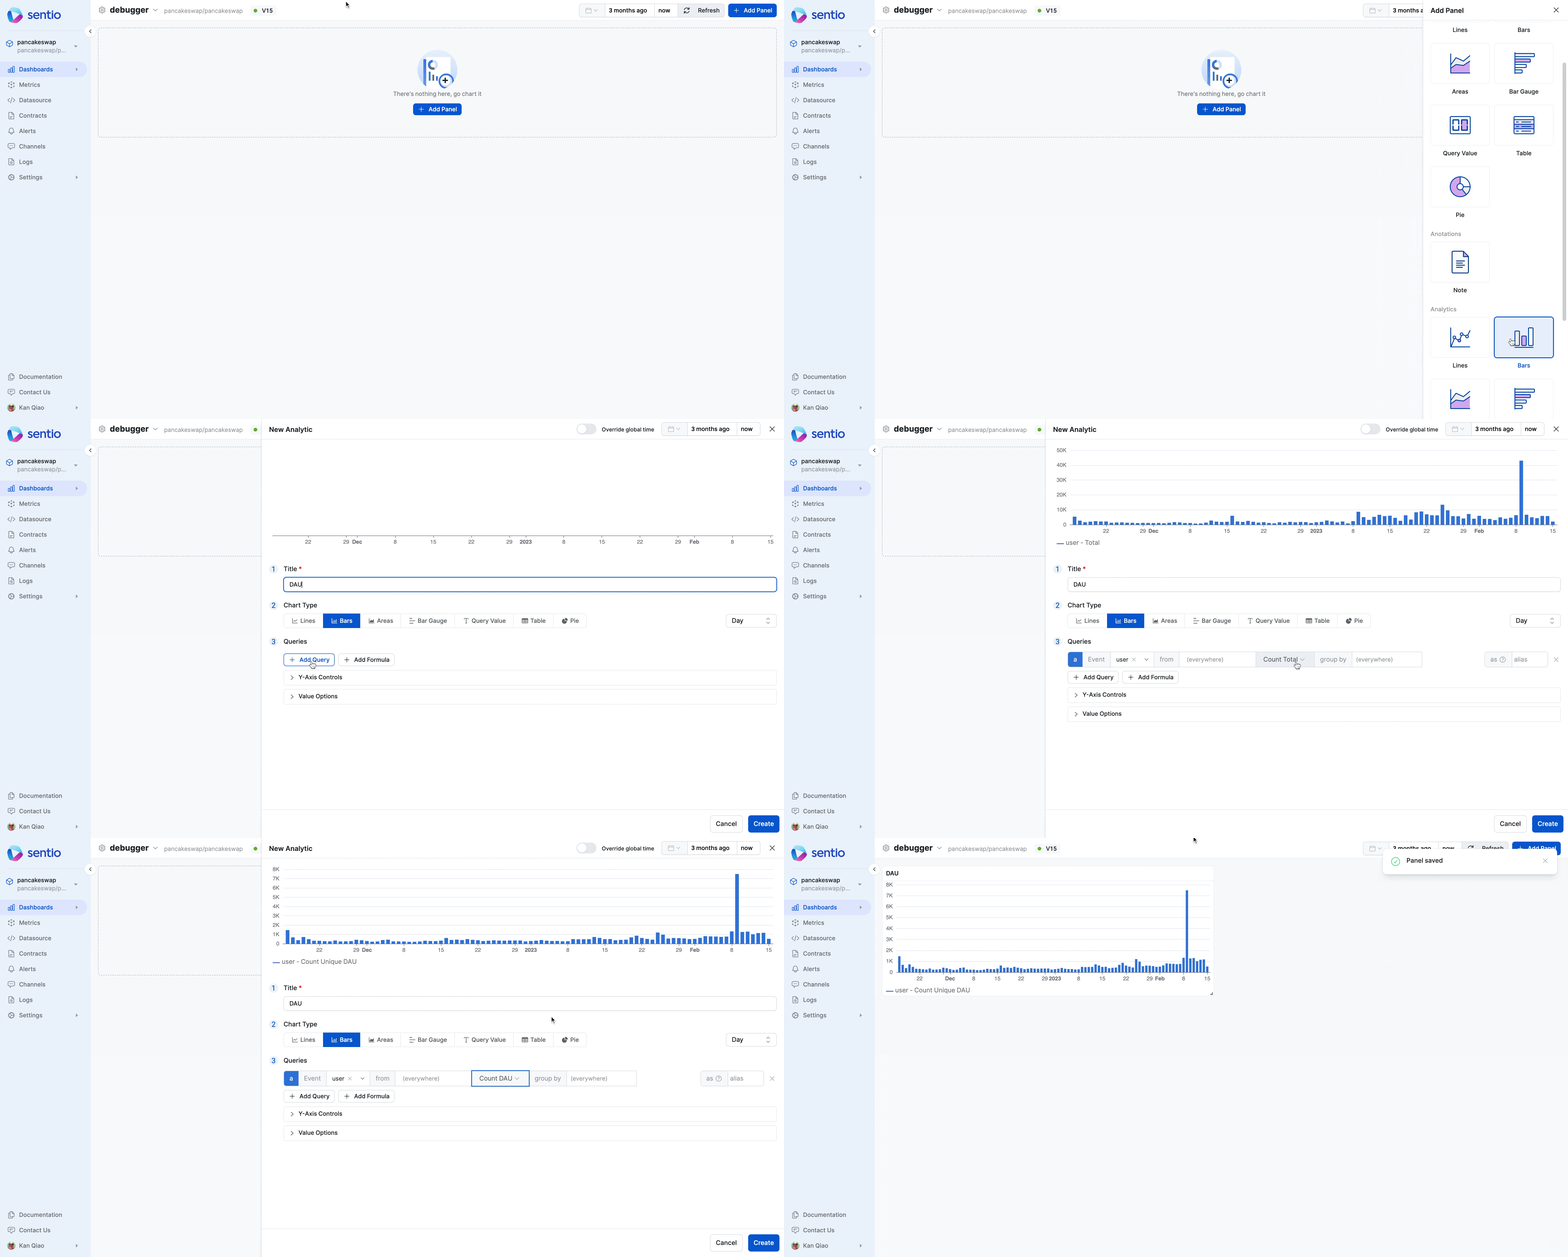
Following monitor-pancake-swap-ifo-deposit, we could build a dashboard to show Daily Active Users.

This requires the event were submitted with #distinct-id
For more complete features of dashboard, refer to dashboard
Updated 7 months ago
